Utah sets a new record for the total value of its financial transactions in a single year with $31.2 billion produced by Utah businesses in 2021, according to data released last week by the MountainWest Capital Network.
In case you had any doubts about it, 2021 was a breakthrough year for financial transactions in Utah, with a disclosed $31.2 billion in deals occurring last year within the state.
That’s based upon data included in the 2021 Deal Flow Report released last Wednesday by the MountainWest Capital Network, the 27th such financial agglomeration published by the nonprofit organization.
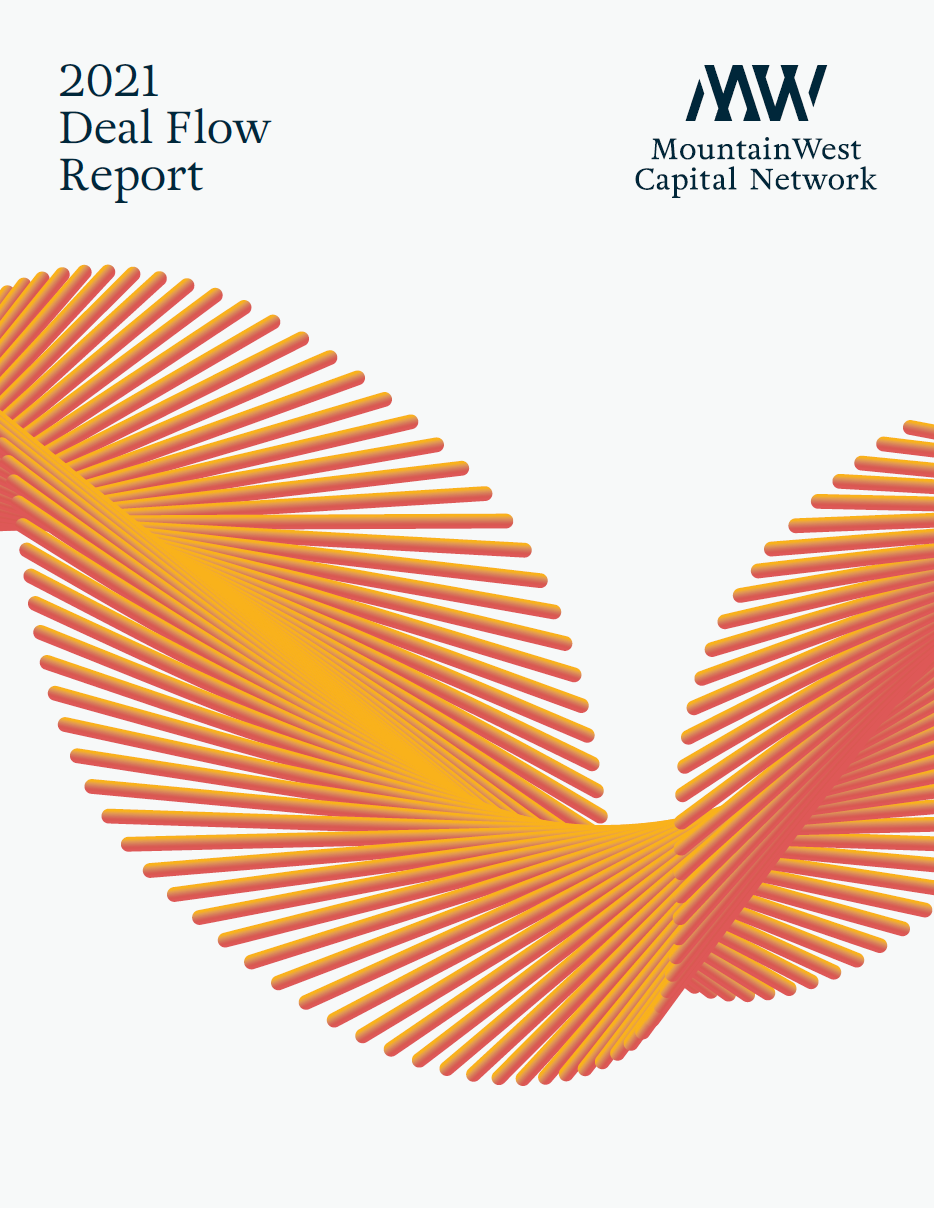
The $31.2 billion figure sets a new record for so-called deal flow in the State of Silicon Slopes, surpassing by nearly 19% the previous record set in 2020 at $26.4 billion of public offerings, mergers and acquisitions (M&A), and various private investments, from venture capital deals to angel investments, as well as private equity transactions and more.
Although this MWCN report comes some four-and-a-half months after the end of the year, it nevertheless provides fascinating insights into the industries and individual organizations within the state that are attracting the most financial interest.
As such, this data also provides clues as to potential future financial winners within Utah’s business ecosystem.
Back to the Future with the MountainWest Venture Group
The MWCN officially got its start back in 1983 as the MountainWest Venture Group when several colleagues recognized the importance of forming an organization to support the needs of entrepreneurs and business owners in the state who needed to raise outside capital.
I learned about the Venture Group shortly after moving back to Utah in late 1987 when I was invited to become an officer and board member of the organization at the beginning of 1988 by President Robert Springmeyer, positions I held for some nine years, including a one-year role as the volunteer president of the org.
Beside becoming an IRS-recognized nonprofit during that nine-year stint, there are two results I am most proud of having had a hand in achieving while an officer/board member of the MWVG:
- The successful launch of the annual Deal Flow Report, and
- The kickoff of the Utah100, the annual ranking of the fastest-growing organizations in Utah by the MWCN.
It was some time after I stepped away from the Venture Group that it changed its name and tweaked its business model.
But the Deal Flow Report has remained a constant, and, if anything, it has grown in value to the community as the only true publicly available data consolidation that attempts to track the major financial transactions that happen annually within the state.
To be clear, not every business owner/investor wants details disclosed about A) How much money they raised, or B) How much money they got paid when they sold their company.
I completely understand and respect this fact.
But this being true, no report, regardless of longevity and/or the efforts of its aggregators/publishers can provide a complete picture of what actually happened in a given year or time frame.
Diving Into the Data
Case in point, this year’s Deal Flow Report names 435 separate financial transactions that it was able to identify as having occurred within 2021, which is amazing, especially since the MWCN was able to tie $31.2 billion in value to said transactions.
But of those deals, the parties in a total of 195 transactions chose not to disclose any amount whatsoever.
That’s nearly 45% of all deals included in the 2021 Deal Flow Report without any dollar figure shared. Period.
Does that mean the Report is flawed? Not at all.
It simply is what it is, with some people and organizations choosing to maintain a level of privacy.
By extension, is it possible that the actual value of the 435 financial transactions from 2021 is 45% higher than reported, placing it over $45 billion?
Not likely, at least not the way the MountainWest Capital Network tracks deal flow. Regardless, clearly the actual total was larger.
Were I to guess, I would place the total valuation of 2021 financial transactions in Utah at somewhere between 10–15% higher, somewhere between $33 billion and $36 billion.
But without guessing, the data is fascinating on its own, especially as you dig into the numbers.
For example, there were a total of 10 transactions in Utah last year that clocked in at over $1 billion each, for a total of $18.18 billion. They are
- $3.5 billion: Pluralsight acquisition by Vista Equity Partners
- $2.5 billion: Divvy acquisition by Bill.com*
- $2.2 billion: Owl Rock Capital and the management team of PCF Insurance Services acquire majority interest in PCF from HGGC, a deal that values PCF at $2.2 billion
- $1.7 billion: BRC valuation upon completing its SPAC merger, aka, public offering
- $1.65 billion: Acima Credit acquired by Rent-A-Center*
- $1.55 billion: Monies raised in Qualtrics Initial Public Offering
- $1.54 billion: Dominion Energy Questar Pipeline asset sale to Southwest Gas Holdings
- $1.4 billion: NetDocuments’ significant ownership position sold to Warburg Pincus
- $1.39 billion: Owlet Baby Care valuation upon completing its SPAC merger, aka, public offering
- $1.0 billion: Enerbank USA acquired by Regions Bank
During the past five years, 2017–2021, MWCN identified nearly 2,200 total financial transactions, with a low of 289 deals in 2020 and a high of 514 deals in 2017.
But the average of 439 deals per year puts the 2021 results of 435 transactions at almost exactly at the annual average, except for one thing.
Fascinatingly, last year's average deal size for those that disclosed such information clocked in at $130 million.
By contrast, when you calculate the deal size across each of the past five years the average is $52.4 million.
To be clear, that's for all deals, disclosed or not. But still, that’s a massive difference between last year and the five-year average.
Other tidbits I found interesting from the 2021 Deal Flow Report included the following,
- 41.7% of all transactions in 2021 were in the software/technology sector, while
- Conversely, 31% took place within the consumer/retail sector.
Additionally, of the $31.2 billion in 2021 translation values,
- $18.7 billion occurred via mergers and acquisitions,
- $8.14 billion occurred via public offerings*, and
- $4.56 billion occurred via private investments.
Last of all, during 2021 there were
- 225 M&A transactions,
- 191 Private investments, and
- 19 public offerings.
I encourage you to download your own copy of the 2021 Deal Flow Report to get a full rundown on the data compiled by the MountainWest Capital Network.
Personally, I kind of geek-out on such stuff.
* – AUTHOR’S NOTE UPDATED: According to my calculations, publicly available data increases Utah's total 2021 financial transaction value to a minimum of $36.1 billion. This increase is achieved by including the $3.2 billion acquisition of LHM Dealerships and other related businesses and assets, as well as increasing the totals for the following three transactions:
- $300 million extra paid by Vista Equity Partners to acquire Pluralsight ($3.8 billion versus $3.5 billion, as noted in this Reuters story);
- $2.5 billion paid by Bill.com to acquire Divvy versus $2.2 billion (an increase of $300 million); and
- $256 million extra paid by Rent-A-Center to acquire Acima Credit ($1.65 billion versus $1.394 billion).